The Internet
The Internet page looks past your own connection, at each site that PeakHour measures: the three Internet Hosts of the dashboard, and any latency monitors that you added yourself.
Issues outside your network
Section titled “Issues outside your network”
This card appears when one site has a problem that the others don’t — for example The route to GitHub is unsteady (jitter), or AU VPN does not answer.
These issues don’t lower your grade. When the other sites are fine, your connection is fine, and the problem is on the route to that one site or at the site itself. There is usually nothing to change at home.
A site far away is judged against its own normal latency. A server in another continent is slow on every sample because of the distance, so PeakHour only reports it when it gets slower than it usually is.
The map
Section titled “The map”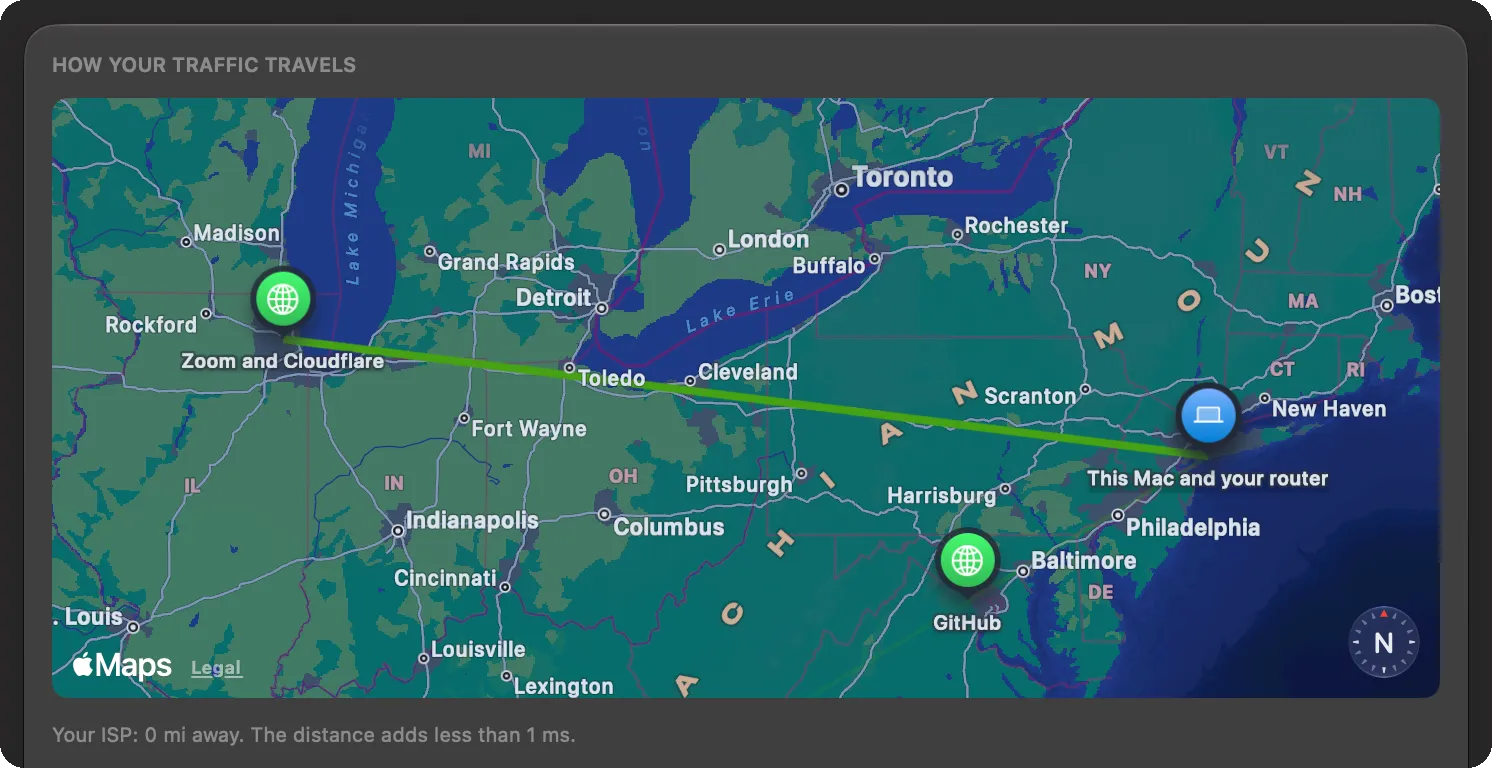
The How your traffic travels card starts with a map:
- Your router sits at the place of your public IP address. With Location Services allowed, the pin moves to this Mac’s own position and reads This Mac and your router. Your Mac’s location never leaves your Mac.
- Your ISP, or the VPN server when a VPN carries all of your traffic.
- Each site, at the data centre it answers from. The place comes from the names of the routers near the site, or from the location of its address.
Under the map, a note gives the distance to your ISP and the least latency that distance allows — for example Your ISP: 9 mi away. The distance adds less than 1 ms. Click a site’s box to see the same note for that site.
Hover over a route below the map, and the map zooms to show that route from end to end. Hover over a router in an open route, and a pin marks its place.
The routes
Section titled “The routes”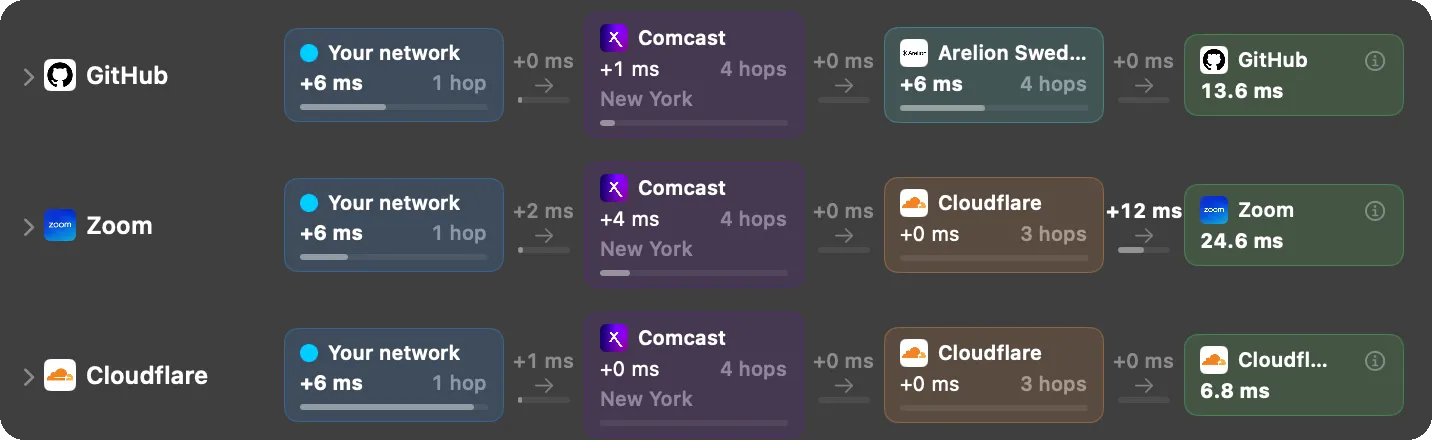
Each site has one row. The row shows the networks your traffic crosses on the way, from Your network on the left to the site on the right.
- A box is one network — for example your ISP or a carrier such as Arelion or Cogent — with its logo, the delay inside it and the number of routers it has.
- An arrow between two boxes is the handoff from one network to the next, with its delay.
- The boxes and the arrows add up to the latency of the site.
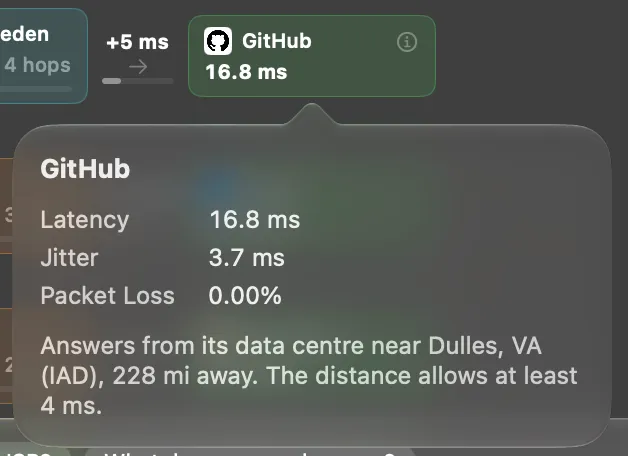
- The site’s box, at the end, shows its latency. Click it for its latency, jitter and packet loss, and where it answers from.
The routes appear one by one while PeakHour traces them. A site that doesn’t answer shows Not traced.
The hop table
Section titled “The hop table”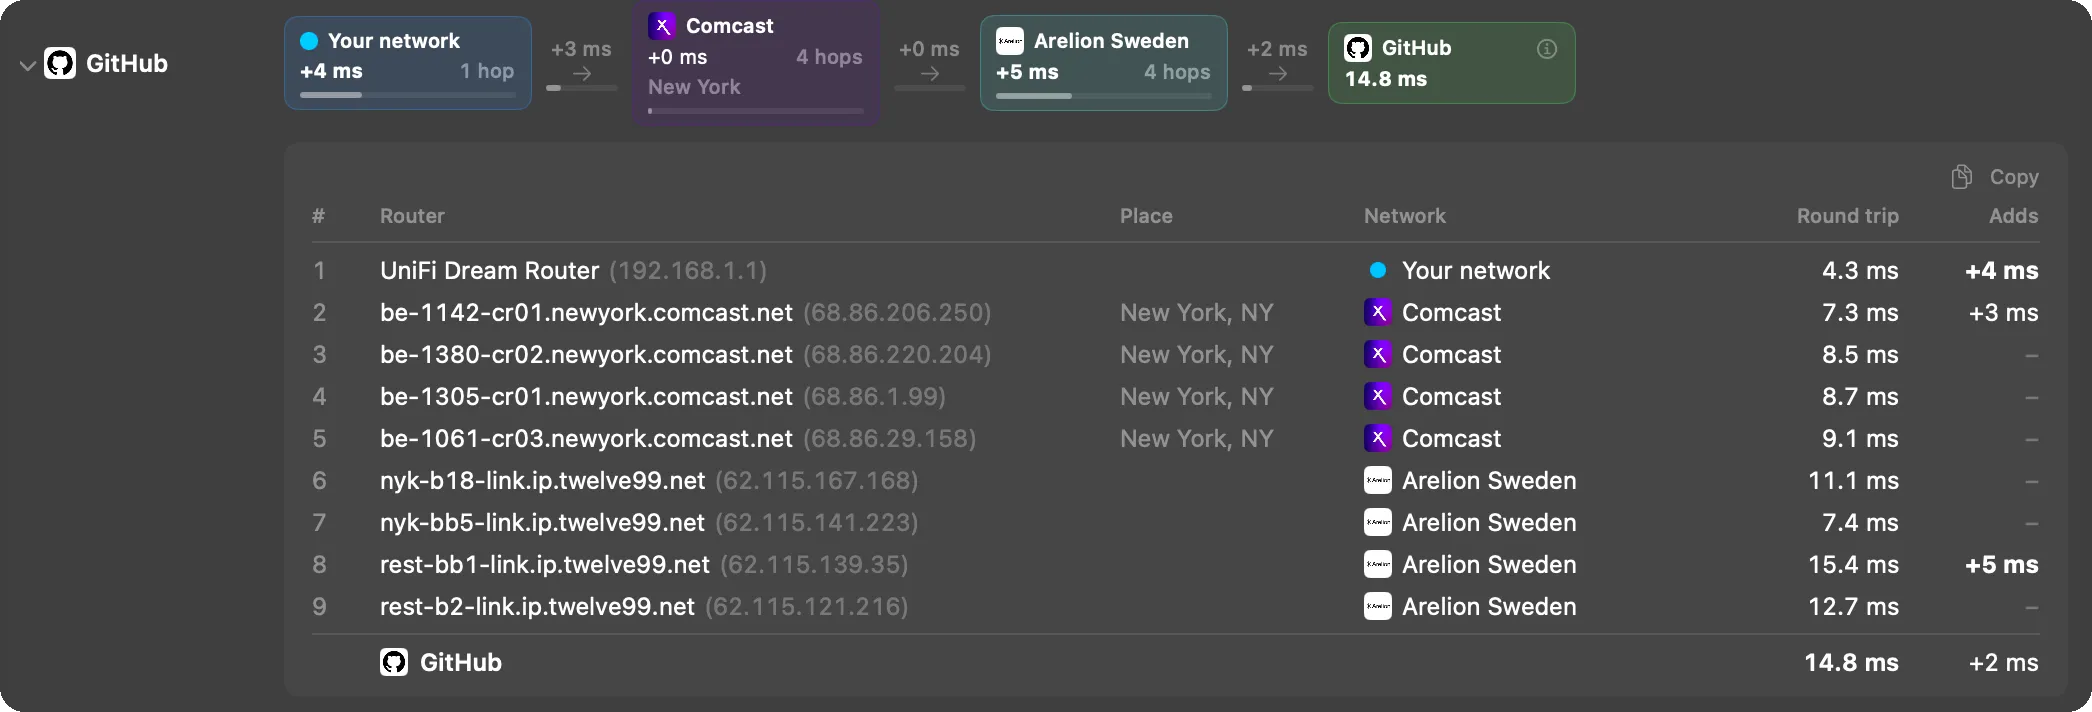
Click the name of a site to open its hop table, with one line for each router on the route:
| Column | What it shows |
|---|---|
| # | The position of the router on the route. Hop 1 is your router, by the name that the dashboard uses. |
| Router | The router’s name, with its address in brackets. |
| Place | The city, when the router’s name gives it away — for example Newark, NJ. |
| Network | The network the router belongs to. internal marks an address that the network doesn’t announce publicly. |
| Round trip | The time to the router and back. A grey value marks a router that answers slowly while traffic passes it quickly. |
| Adds | The delay this router adds to the one before it. |
Routers that don’t answer show as No answer, and several in a row share one line. The last line is the site itself.
Click Copy to copy the table as plain text, with padded columns — ready to paste into an email to your ISP or a support ticket.
Reading the route
Section titled “Reading the route”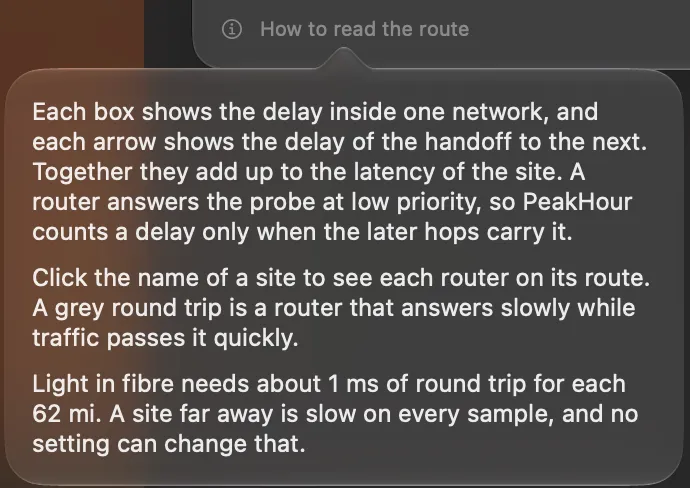
Click How to read the route under the rows for a short summary. In more detail:
- Routers answer at low priority. A router forwards traffic quickly, but it answers PeakHour’s probes when it has time. So a router can show a high round trip while the routers after it are fast. PeakHour only counts a delay when the later routers carry it too, and marks the rest grey.
- Distance sets a floor. Light in fibre needs about 1 ms of round trip for every 100 km (62 miles). A site 3,000 km away can’t answer in less than about 30 ms, however good your connection is.
- A large arrow means the delay appears at the handoff between two networks, not inside either of them.
Why a site is not your connection
Section titled “Why a site is not your connection”Your grade measures your own connection, averaged over several sites. A single slow site says little about your connection. Its route crosses networks that neither you nor your ISP control, and its servers can be busy.
When every site is slow, the problem is on your connection, and it shows under Issues identified on the Your Network page instead.
Your own monitors
Section titled “Your own monitors”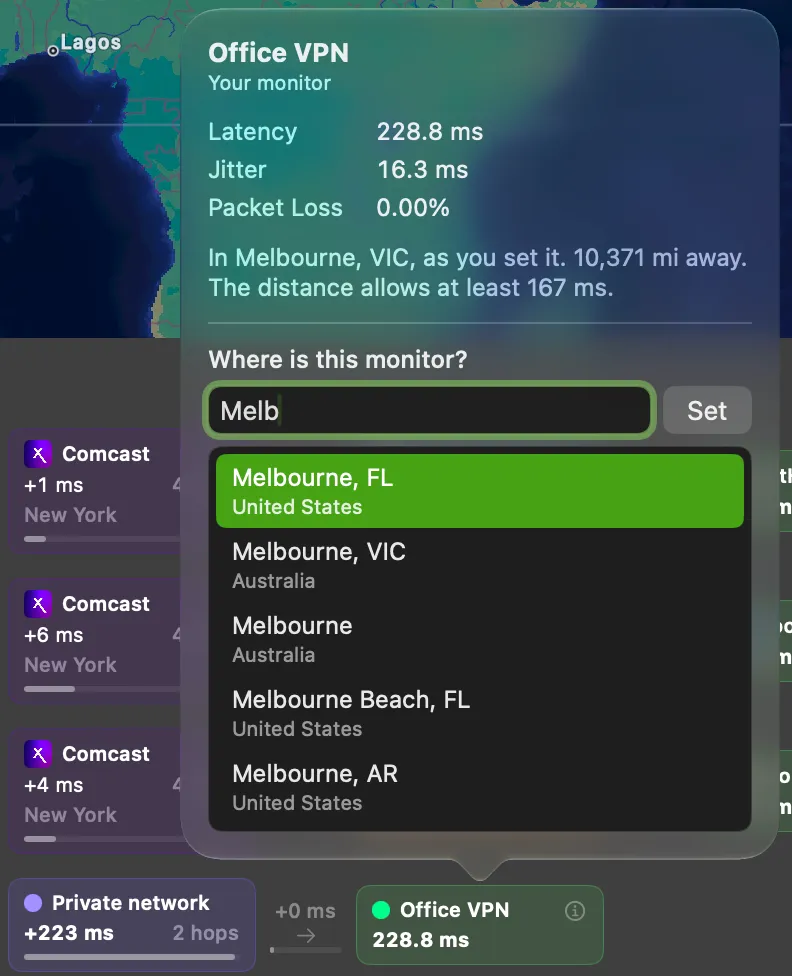
A latency monitor that you added — for example a game server or a work VPN — appears here with Your monitor under its name.
Private addresses. A monitor with a private address, such as a server at another office over a site-to-site VPN, is traced too. The private part of its route shows as one Private network box. A private address has no public location, so click the monitor’s box and type a city under Where is this monitor? to put it on the map. The place stays on this Mac.
When a VPN is on
Section titled “When a VPN is on”When a VPN carries all of your traffic, each route starts with a VPN box, and hop 1 in the hop table reads VPN gateway. The networks after it are those of the VPN provider and beyond, not your ISP’s.
While a VPN carries all traffic, sites at private addresses on your own networks are usually out of reach, and the Advisor says so.
Was this page helpful?
Found something wrong, unclear, or out of date? Let us know and we'll fix it.